Color names
ProPlot registers several new color names and includes tools for defining your own color names. These features are described below.
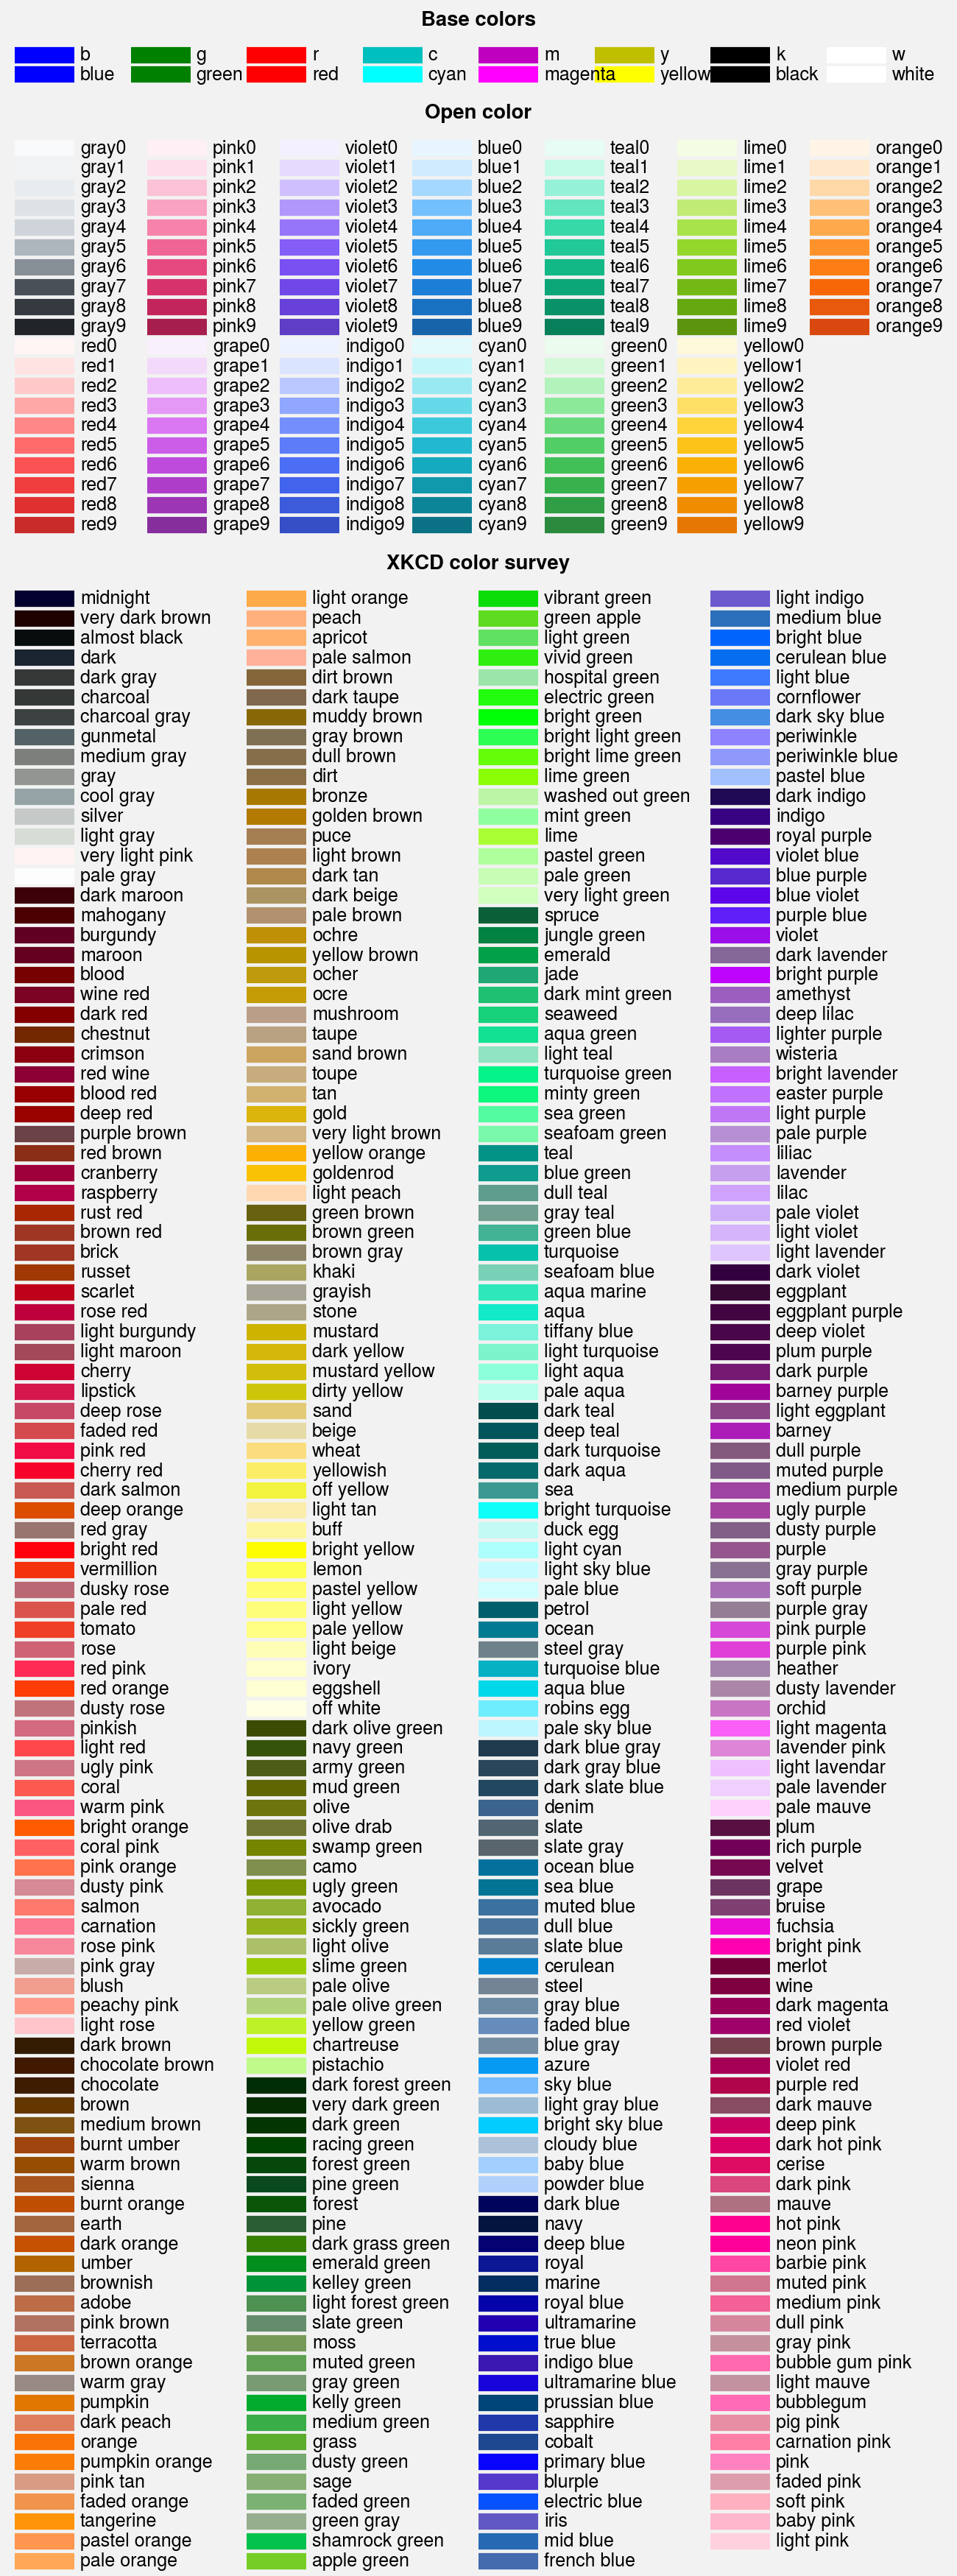
Included colors
ProPlot adds new color names from the XKCD color survey and
the Open Color UI design color
palettes. You can use show_colors to generate a table of these
colors. Note that matplotlib’s native X11/CSS4 named colors are still
registered, but some of these color names may be overwritten by the XKCD names,
and we encourage choosing colors from the below tables instead. ProPlot
registers the XKCD names because the selection is larger and the names are
more likely to match your intuition for what a color “should” look like.
To reduce the number of registered color names to a more manageable size,
ProPlot filters the available XKCD colors so that they are sufficiently
distinct in the perceptually uniform colorspace.
This makes it a bit easier to pick out colors from the table generated with
show_colors. Similar names were also cleaned up – for
example, 'reddish' and 'reddy' are changed to 'red'.
[1]:
import proplot as pplt
fig, axs = pplt.show_colors()
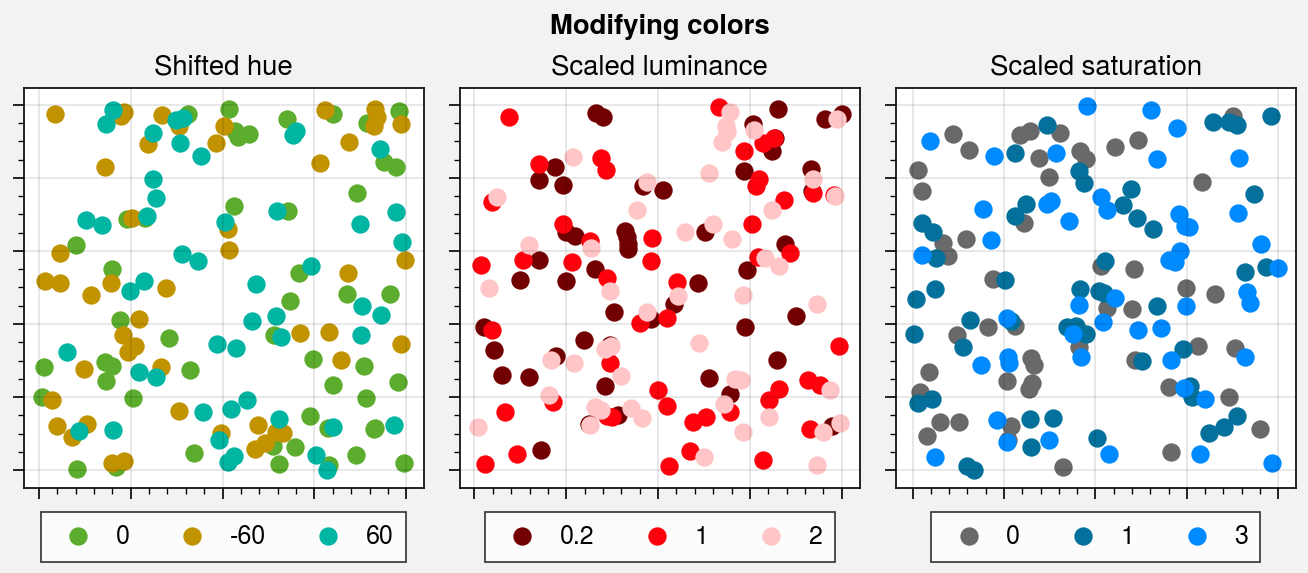
Modifying colors
You can quickly modify colors using the set_hue, set_saturation,
set_luminance, shift_hue,
scale_saturation and scale_luminance
functions. The set functions change individual hue, saturation, or
luminance values in the perceptually uniform colorspace
specified by the space keyword. The scale functions shift or scale
the hue, saturation, or luminance by the input value – for example,
scale_luminance('color', 1.2) makes 'color' color 20% brighter. These
are useful for creating color gradations outside of Cycle or
if you simply spot a color you like and want to make it a bit brighter,
less vibrant, etc.
[2]:
import proplot as pplt
import numpy as np

# Figure
state = np.random.RandomState(51423)
fig, axs = pplt.subplots(ncols=3, axwidth=2)
axs.format(
    suptitle='Modifying colors',
    toplabels=('Shifted hue', 'Scaled luminance', 'Scaled saturation'),
    toplabelweight='normal',
    xformatter='none', yformatter='none',
)

# Shifted hue
with pplt.rc.context({'legend.handlelength': 0}):
    N = 50
    marker = 'o'
    for shift in (0, -60, 60):
        x, y = state.rand(2, N)
        color = pplt.shift_hue('grass', shift)
        axs[0].scatter(x, y, marker=marker, c=color, legend='b', label=shift)

    # Scaled luminance
    for scale in (0.2, 1, 2):
        x, y = state.rand(2, N)
        color = pplt.scale_luminance('bright red', scale)
        axs[1].scatter(x, y, marker=marker, c=color, legend='b', label=scale)

    # Scaled saturation
    for scale in (0, 1, 3):
        x, y = state.rand(2, N)
        color = pplt.scale_saturation('ocean blue', scale)
        axs[2].scatter(x, y, marker=marker, c=color, legend='b', label=scale)
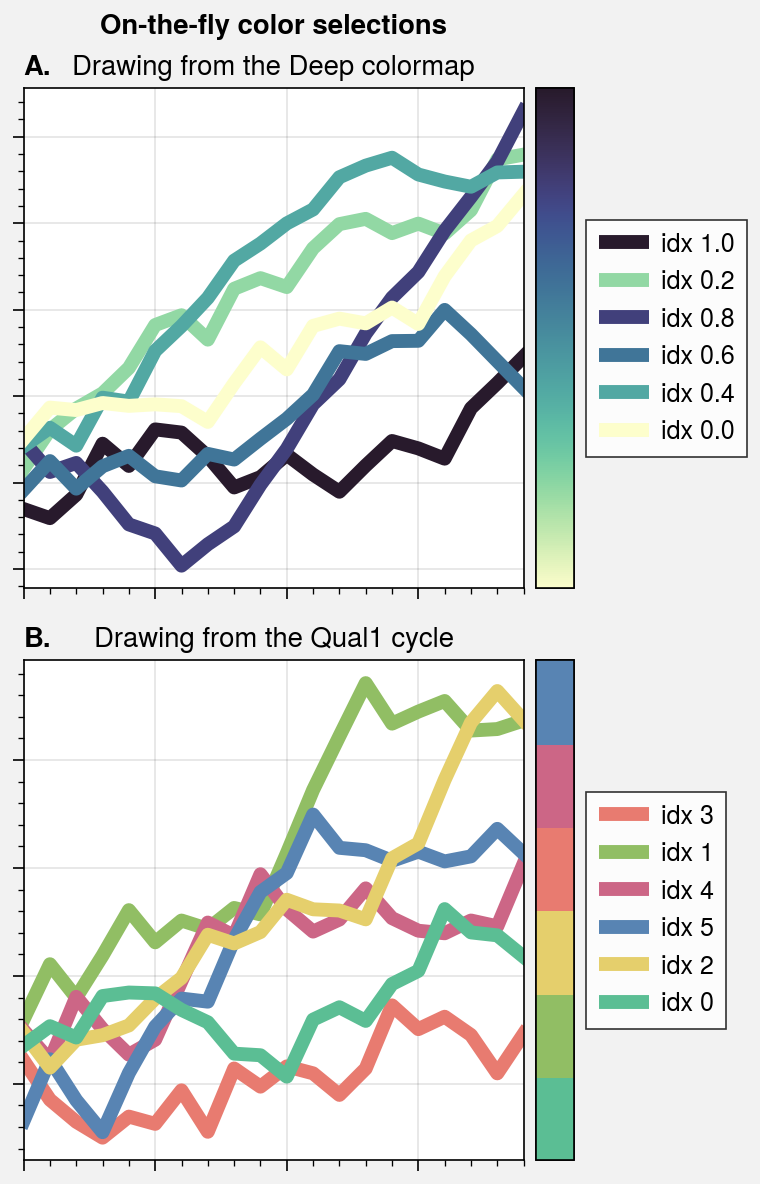
Colors from colormaps
If you want to draw an individual color from a colormap or a color cycle,
use color=(cmap, coord) or color=(cycle, index) with any command
that accepts the color keyword. The coord should be between 0 and
1, while the index is the index on the list of cycle colors. This
feature is powered by the ColorDatabase class. This is
useful if you spot a nice color in one of the available colormaps or color
cycles and want to use it for some arbitrary plot element. Use the
to_rgb or to_rgba functions to retrieve
the RGB or RGBA channel values.
[3]:
import proplot as pplt
import numpy as np

# Figure
fig, axs = pplt.subplots(nrows=2, share=0)
axs.format(
    xformatter='null', yformatter='null', abc=True, abcloc='l', abcstyle='A.',
    suptitle='On-the-fly color selections'
)

# Drawing from colormaps
ax = axs[0]
name = 'Deep'
idxs = pplt.arange(0, 1, 0.2)
state = np.random.RandomState(51423)
state.shuffle(idxs)
for idx in idxs:
    data = (state.rand(20) - 0.4).cumsum()
    h = ax.plot(
        data, lw=5, color=(name, idx),
        label=f'idx {idx:.1f}', legend='r', legend_kw={'ncols': 1}
    )
ax.colorbar(pplt.Colormap(name), loc='r', locator='none')
ax.format(title=f'Drawing from the {name} colormap', grid=True)

# Drawing from color cycles
ax = axs[1]
name = 'Qual1'
idxs = np.arange(6)
state.shuffle(idxs)
for idx in idxs:
    data = (state.rand(20) - 0.4).cumsum()
    h = ax.plot(
        data, lw=5, color=(name, idx),
        label=f'idx {idx:.0f}', legend='r', legend_kw={'ncols': 1}
    )
ax.colorbar(pplt.Colormap(name), loc='r', locator='none')
ax.format(title=f'Drawing from the {name} cycle')
Using your own colors
You can register your own colors by adding .txt files to the
~/.proplot/colors directory and calling
register_colors. This command is also called on import.
Each file should contain lines that look like color: #xxyyzz where
color is the registered color name and #xxyyzz is the HEX color
value. Lines beginning with # are ignored as comments.