Colorbars and legends
ProPlot includes some useful improvements to the matplotlib API that make working with colorbars and legends much easier.
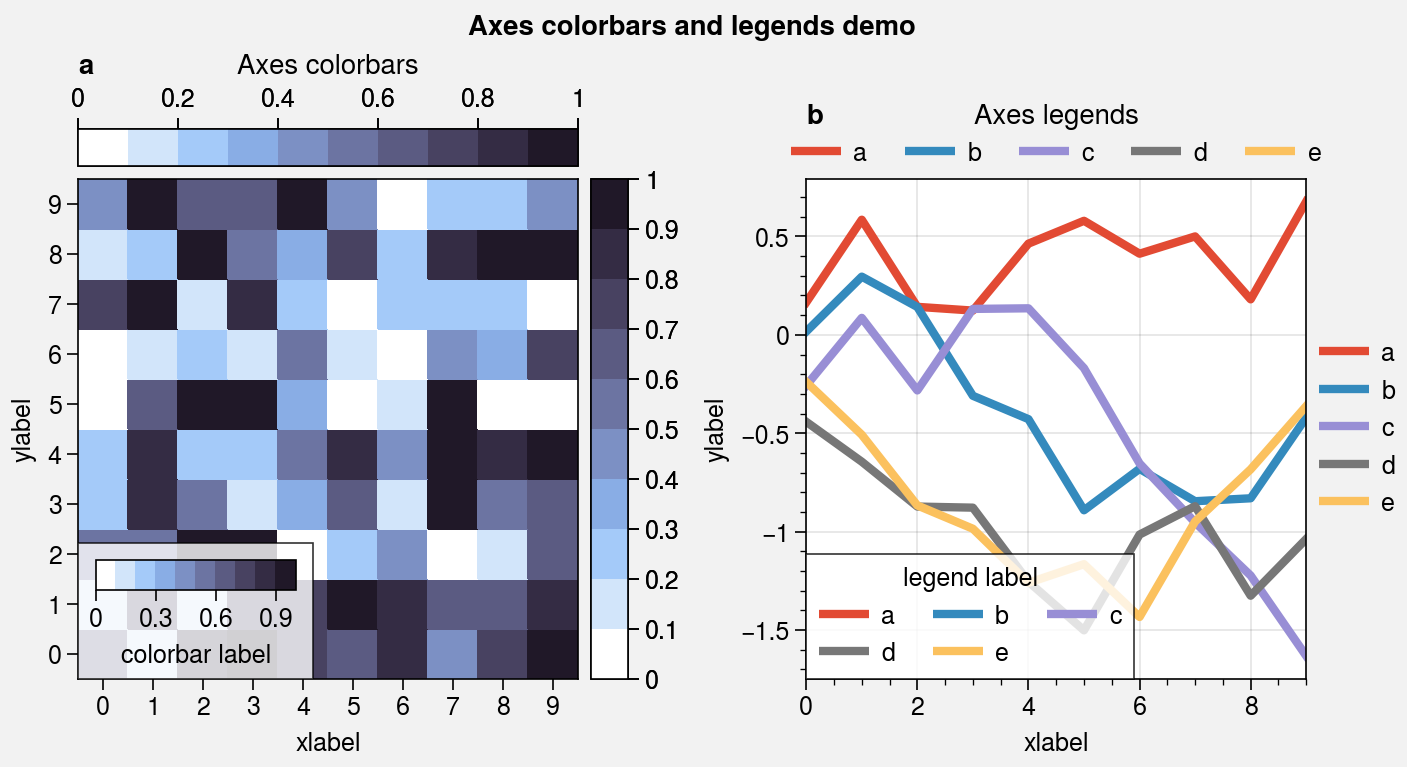
Axes colorbars and legends
In matplotlib, colorbars are added to the edges of subplots using the figure
method matplotlib.figure.Figure.colorbar
(e.g., fig.colorbar(m, ax=ax, location='right').
In ProPlot, this is done using the axes method
proplot.axes.Axes.colorbar (e.g., ax.colorbar(m, loc='r').
proplot.axes.Axes.colorbar preserves subplot aspect ratios and visual
symmetry between subplots by allocating new space in the figure
GridSpec rather than “stealing” space from the parent subplot
(see the automatic spacing section for details).
ProPlot tries to make the usage of proplot.axes.Axes.colorbar consistent
with legend, and includes an improved axes method
proplot.axes.Axes.legend that tries to do the same:
Just like
colorbar,proplot.axes.Axes.legendcan draw “outer” legends along the edges of subplots when you request a side location for the legend (e.g.,loc='right'orloc='r'). If you draw multiple colorbars and legends on one side, they are “stacked” on top of each other.Just like
legend,proplot.axes.Axes.colorbarcan draw “inset” colorbars when you request an inset location for the colorbar (e.g.,loc='upper right'orloc='ur'). Inset colorbars have optional background “frames” that can be configured with variouscolorbarkeywords.
You can also draw colorbars and legends on-the-fly by supplying keyword arguments
to various plotting commands. To plot data and draw a colorbar in one go, pass a
location (e.g., colorbar='r') to methods that accept a cmap argument (e.g.
contourf). To draw a legend or colorbar-legend in
one go, pass a location (e.g., legend='r' or colorbar='r') to
methods that accept a cycle argument (e.g., plot).
Use legend_kw and colorbar_kw to pass keyword arguments to the colorbar
and legend functions. This feature is powered by the apply_cmap and
apply_cycle wrappers.
[1]:
import proplot as pplt
import numpy as np
with pplt.rc.context(abc=True):
    fig, axs = pplt.subplots(ncols=2, share=0)

# Colorbars
ax = axs[0]
state = np.random.RandomState(51423)
m = ax.heatmap(state.rand(10, 10), colorbar='t', cmap='dusk')
ax.colorbar(m, loc='r')
ax.colorbar(m, loc='ll', label='colorbar label')
ax.format(title='Axes colorbars', suptitle='Axes colorbars and legends demo')

# Legends
ax = axs[1]
ax.format(title='Axes legends', titlepad='0em')
hs = ax.plot(
    (state.rand(10, 5) - 0.5).cumsum(axis=0), linewidth=3,
    cycle='ggplot', legend='t',
    labels=list('abcde'), legend_kw={'ncols': 5, 'frame': False}
)
ax.legend(hs, loc='r', ncols=1, frame=False)
ax.legend(hs, loc='ll', label='legend label')
axs.format(xlabel='xlabel', ylabel='ylabel')
[2]:
import proplot as pplt
import numpy as np
fig, axs = pplt.subplots(nrows=2, share=0, refwidth='55mm', panelpad='1em')
axs.format(suptitle='Stacked colorbars demo')
state = np.random.RandomState(51423)
N = 10
# Repeat for both axes
for j, ax in enumerate(axs):
    ax.format(
        xlabel='data', xlocator=np.linspace(0, 0.8, 5),
        title=f'Subplot #{j+1}'
    )
    for i, (x0, y0, x1, y1, cmap, scale) in enumerate((
        (0, 0.5, 1, 1, 'grays', 0.5),
        (0, 0, 0.5, 0.5, 'reds', 1),
        (0.5, 0, 1, 0.5, 'blues', 2)
    )):
        if j == 1 and i == 0:
            continue
        data = state.rand(N, N) * scale
        x, y = np.linspace(x0, x1, N + 1), np.linspace(y0, y1, N + 1)
        m = ax.pcolormesh(
            x, y, data, cmap=cmap,
            levels=np.linspace(0, scale, 11)
        )
        ax.colorbar(m, loc='l', label=f'dataset #{i+1}')
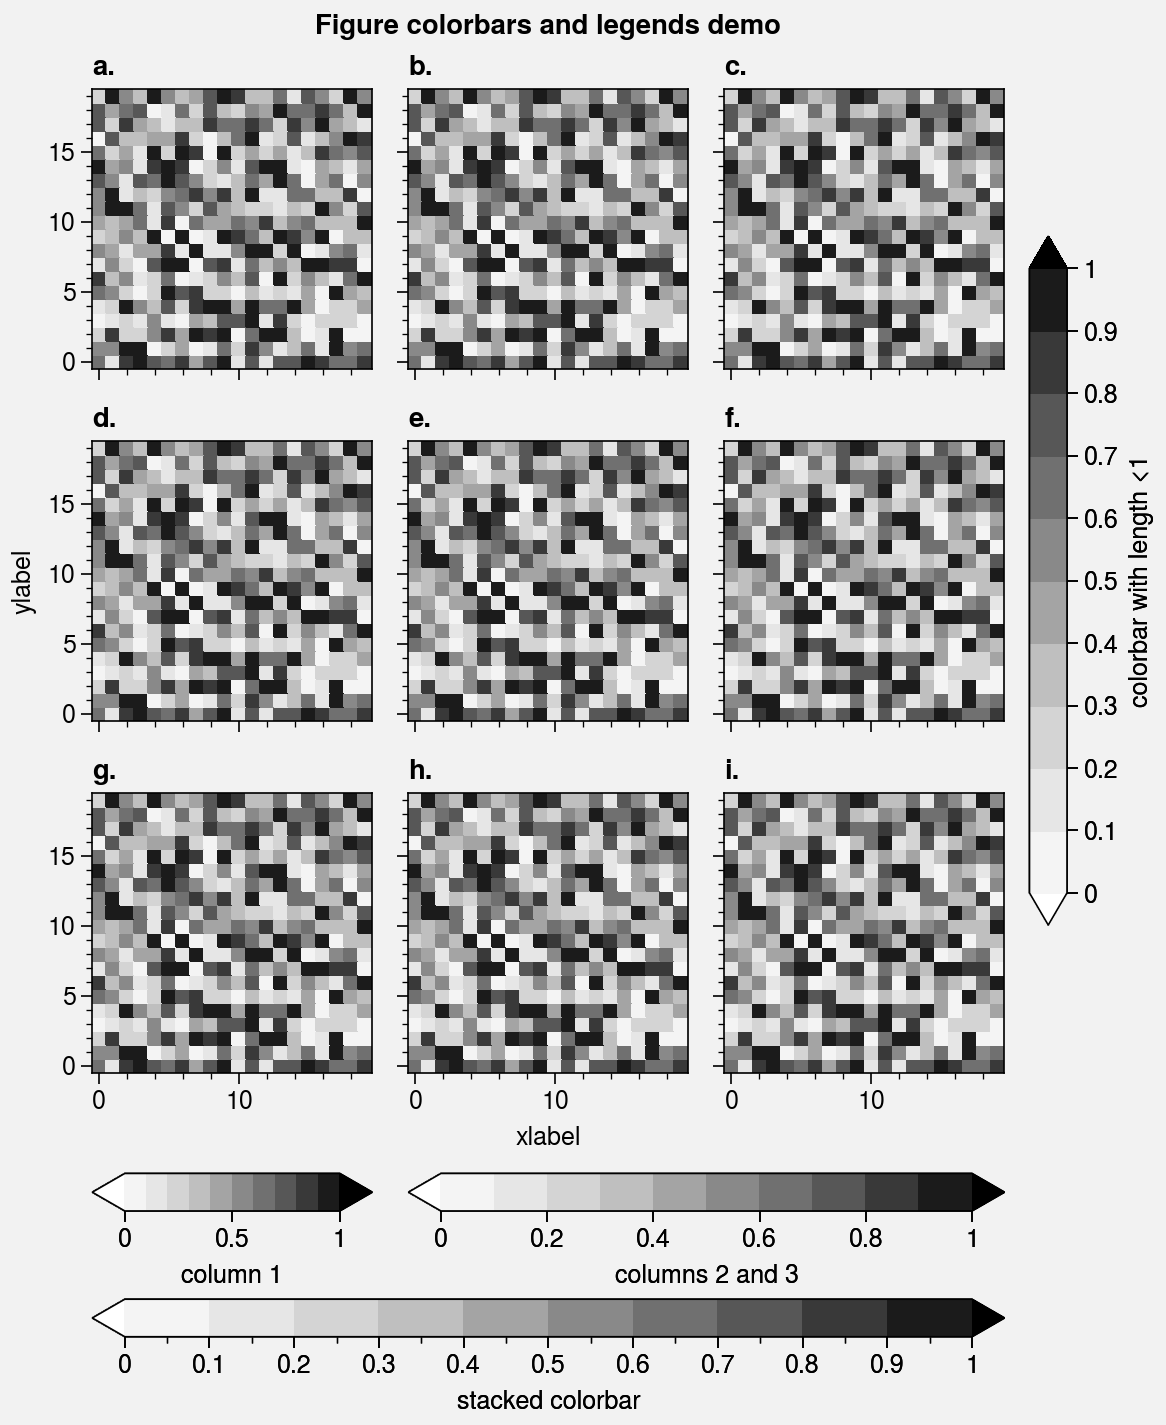
Figure colorbars and legends
In ProPlot, colorbars and legends can be added to the edge of figures using the figure
methods proplot.figure.Figure.colorbar and proplot.figure.Figure.legend. These
methods align colorbars and legends between the edges of the subplot grid rather
than the figure. As with axes colorbars and legends, if
you draw multiple colorbars or legends on the same side, they are stacked on top of
each other.
To draw a colorbar or legend alongside particular row(s) or column(s) of
the subplot grid, use the row, rows, col, or cols keyword arguments.
Pass an integer to draw the colorbar or legend beside a single row or column,
or pass a tuple to draw it beside a range of rows or columns.
[3]:
import proplot as pplt
import numpy as np
fig, axs = pplt.subplots(ncols=3, nrows=3, refwidth=1.4)
state = np.random.RandomState(51423)
m = axs.pcolormesh(
    state.rand(20, 20), cmap='grays',
    levels=np.linspace(0, 1, 11), extend='both'
)[0]
axs.format(
    suptitle='Figure colorbars and legends demo', abc=True,
    abcloc='l', abcstyle='a.', xlabel='xlabel', ylabel='ylabel'
)
fig.colorbar(m, label='column 1', ticks=0.5, loc='b', col=1)
fig.colorbar(m, label='columns 2 and 3', ticks=0.2, loc='b', cols=(2, 3))
fig.colorbar(m, label='stacked colorbar', ticks=0.1, loc='b', minorticks=0.05)
fig.colorbar(m, label='colorbar with length <1', ticks=0.1, loc='r', length=0.7)
[3]:
<matplotlib.colorbar.Colorbar at 0x7f3724a64b80>
[4]:
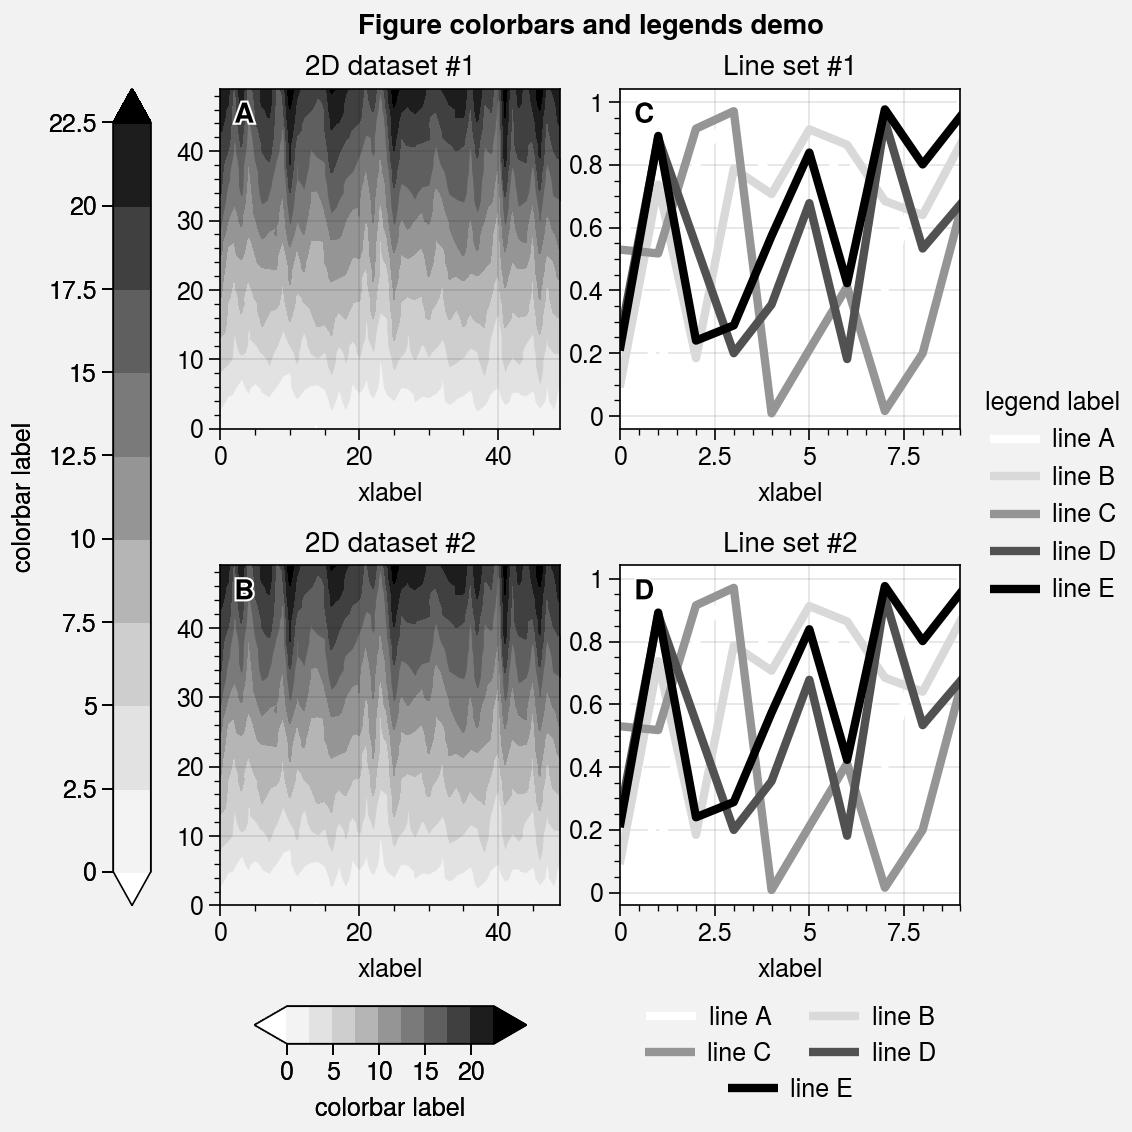
import proplot as pplt
import numpy as np
fig, axs = pplt.subplots(
    ncols=2, nrows=2, refwidth=1.7,
    share=0, wspace=0.3, order='F'
)

# Plot data
data = (np.random.rand(50, 50) - 0.1).cumsum(axis=0)
m = axs[:2].contourf(data, cmap='grays', extend='both')
colors = pplt.Colors('grays', 5)
hs = []
state = np.random.RandomState(51423)
for abc, color in zip('ABCDEF', colors):
    h = axs[2:].plot(state.rand(10), lw=3, color=color, label=f'line {abc}')
    hs.extend(h[0])

# Add colorbars and legends
fig.colorbar(m[0], length=0.8, label='colorbar label', loc='b', col=1, locator=5)
fig.colorbar(m[0], label='colorbar label', loc='l')
fig.legend(hs, ncols=2, center=True, frame=False, loc='b', col=2)
fig.legend(hs, ncols=1, label='legend label', frame=False, loc='r')
axs.format(
    suptitle='Figure colorbars and legends demo',
    abc=True, abcloc='ul', abcstyle='A'
)
for ax, title in zip(
    axs, ['2D dataset #1', '2D dataset #2', 'Line set #1', 'Line set #2']
):
    ax.format(xlabel='xlabel', title=title)
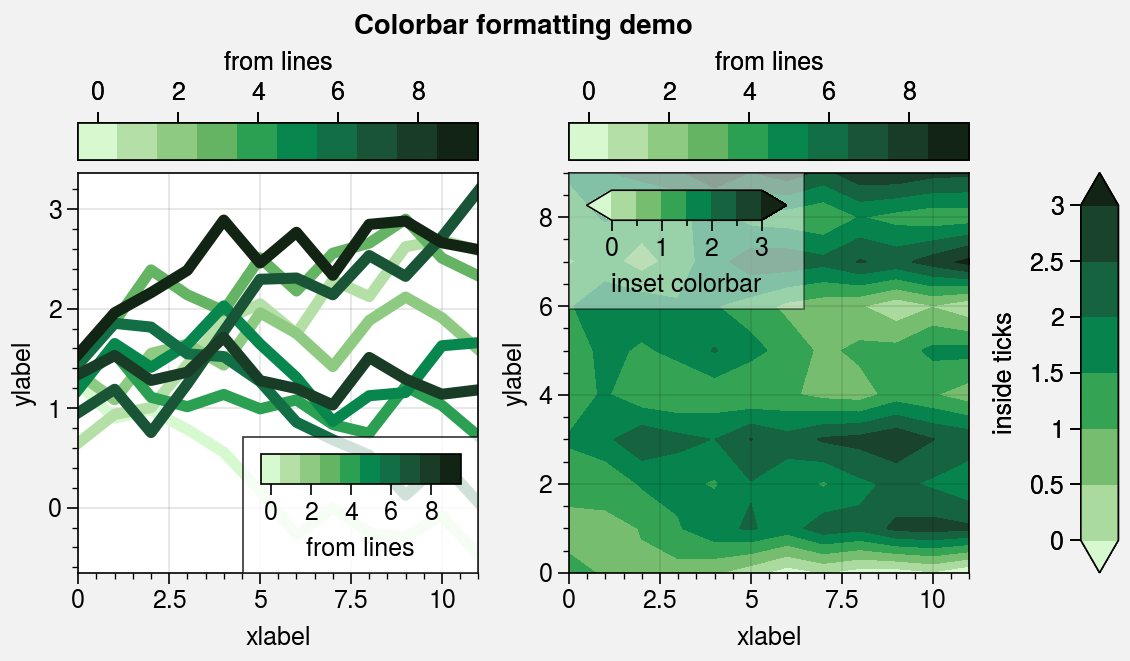
Additional colorbar features
The proplot.figure.Figure.colorbar and proplot.axes.Axes.colorbar
methods are wrapped by colorbar_extras, which adds several
new features.
You can now draw colorbars from lists of colors or lists of artists by
passing a list instead of a mappable object. Colorbar minor ticks are now
easier to manipulate, and the tick location and formatter arguments are passed
through the Locator and Formatter
constructor functions. The colorbar width and length can be
changed with the width and length keyword args. The colorbar width is now
specified using physical units, which helps avoid the common
issue where colorbars look “too skinny” or “too fat” and preserves the look of the
figure when its size is changed.
[5]:
import proplot as pplt
import numpy as np
fig, axs = pplt.subplots(share=0, ncols=2, refwidth=2)

# Colorbars from lines
ax = axs[0]
state = np.random.RandomState(51423)
data = 1 + (state.rand(12, 10) - 0.45).cumsum(axis=0)
cycle = pplt.Cycle('algae')
hs = ax.plot(
    data, lw=4, cycle=cycle, colorbar='lr',
    colorbar_kw={'length': '8em', 'label': 'from lines'}
)
axs.colorbar(
    hs, loc='t', values=np.arange(0, 10),
    label='from lines', ticks=2
)

# Colorbars from a mappable
ax = axs[1]
m = ax.contourf(
    data.T, extend='both', cmap='algae',
    levels=pplt.arange(0, 3, 0.5)
)
fig.colorbar(
    m, length=1, loc='r', label='inside ticks',
    tickloc='left'
)
ax.colorbar(
    m, loc='ul', length=1, tickminor=True,
    label='inset colorbar', alpha=0.5
)
axs.format(
    suptitle='Colorbar formatting demo',
    xlabel='xlabel', ylabel='ylabel', titleabove=False
)
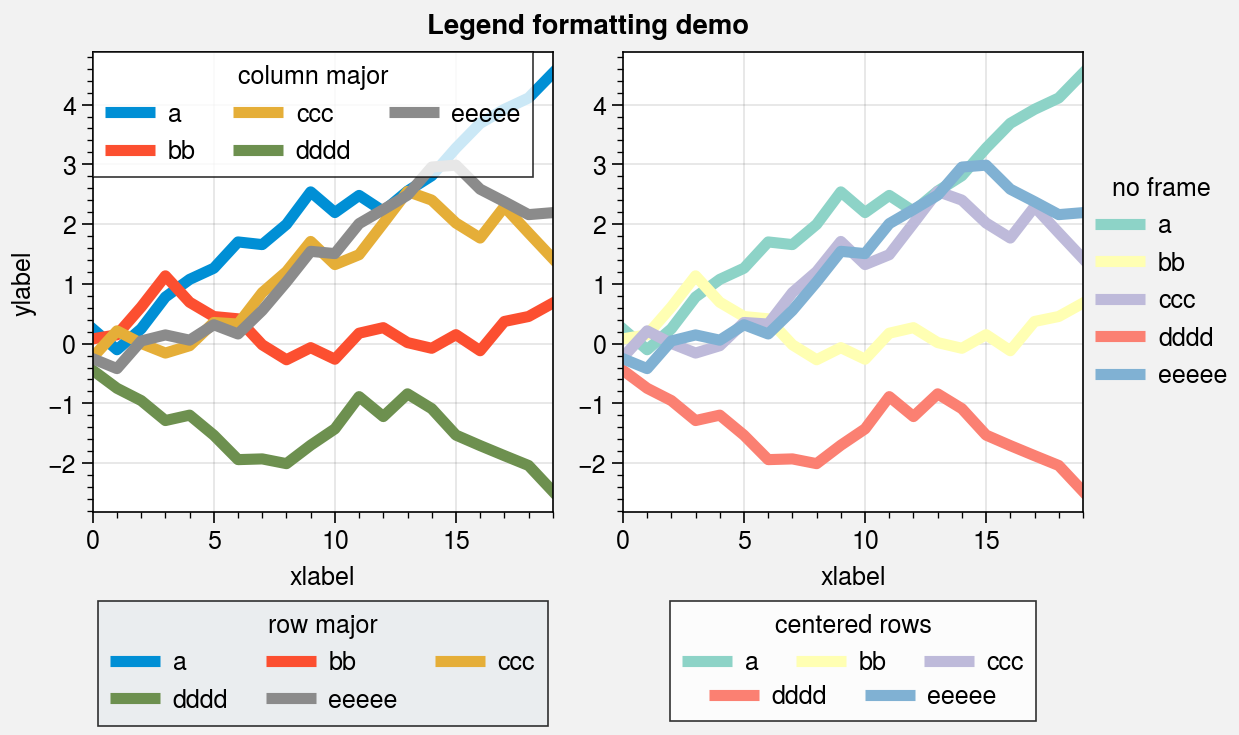
Additional legend features
The proplot.figure.Figure.legend and proplot.axes.Axes.legend methods
are wrapped by legend_extras, which adds several new features.
You can draw legends with centered legend rows, either by passing
center=True or by passing list of lists of plot handles. This is
accomplished by stacking multiple single-row, horizontally centered
legends, then manually adding an encompassing legend frame. You can also
modify legend text and handle properties with several keyword args, and
switch between row-major and column-major order for legend entries with the
order keyword arg (default is row-major).
[6]:
import proplot as pplt
import numpy as np
pplt.rc.cycle = '538'
labels = ['a', 'bb', 'ccc', 'dddd', 'eeeee']
fig, axs = pplt.subplots(ncols=2, span=False, share=1, refwidth=2.3)
hs1, hs2 = [], []

# On-the-fly legends
state = np.random.RandomState(51423)
for i, label in enumerate(labels):
    data = (state.rand(20) - 0.45).cumsum(axis=0)
    h1 = axs[0].plot(
        data, lw=4, label=label, legend='ul',
        legend_kw={'order': 'F', 'title': 'column major'}
    )
    hs1.extend(h1)
    h2 = axs[1].plot(
        data, lw=4, label=label, legend='r', cycle='Set3',
        legend_kw={'ncols': 1, 'frame': False, 'title': 'no frame'}
    )
    hs2.extend(h2)

# Outer legends
ax = axs[0]
ax.legend(
    hs1, loc='b', ncols=3, title='row major', order='C',
    facecolor='gray2'
)
ax = axs[1]
ax.legend(hs2, loc='b', ncols=3, center=True, title='centered rows')
axs.format(xlabel='xlabel', ylabel='ylabel', suptitle='Legend formatting demo')